Publications using astroNN
- Deep learning of multi-element abundances from high-resolution spectroscopic dataHenry W. Leung, Jo Bovy (2019)Original
astroNNpaper - Dynamical heating across the Milky Way disc using APOGEE and GaiaJ. Ted Mackereth, Jo Bovy, Henry W. Leung, et al. (2019)Use
ApogeeBCNNto infer spectroscopic age - Simultaneous calibration of spectro-photometric distances and the Gaia DR2 parallax zero-point offset with deep learningHenry W. Leung, Jo Bovy (2019)Use
ApogeeDR14GaiaDR2BCNNto infer spectro-photometric distances - Solar image denoising with convolutional neural networksC. J. Díaz Baso, J. de la Cruz Rodríguez, S. Danilovic (2019)
- A variational encoder-decoder approach to precise spectroscopic age estimation for large Galactic surveysHenry W. Leung, Jo Bovy, J. Ted Mackereth, Andrea Miglio (2023)Use
ApokascEncoderDecoderto infer spectroscopic age trained on APOGEE and Kepler
Publication figure style
astroNN contains a function that helps me to standardize maplotlib figure style used in my publication.
Set the style of matplotlib to astroNN style
Parameters
- paper: bool
if True, set the style to paper style using Latex
Such function can be used by simply calling it before using matplotlib to plot any figure
1import matplotlib.pylab as plt
2from astroNN.shared import pylab_style
3
4pylab_style(paper=True)
5
6# matplotlib code goes here
If you do not have \(\LaTeX\) installed on your computer, you can set the paper option to False like pylab_style(paper=False)
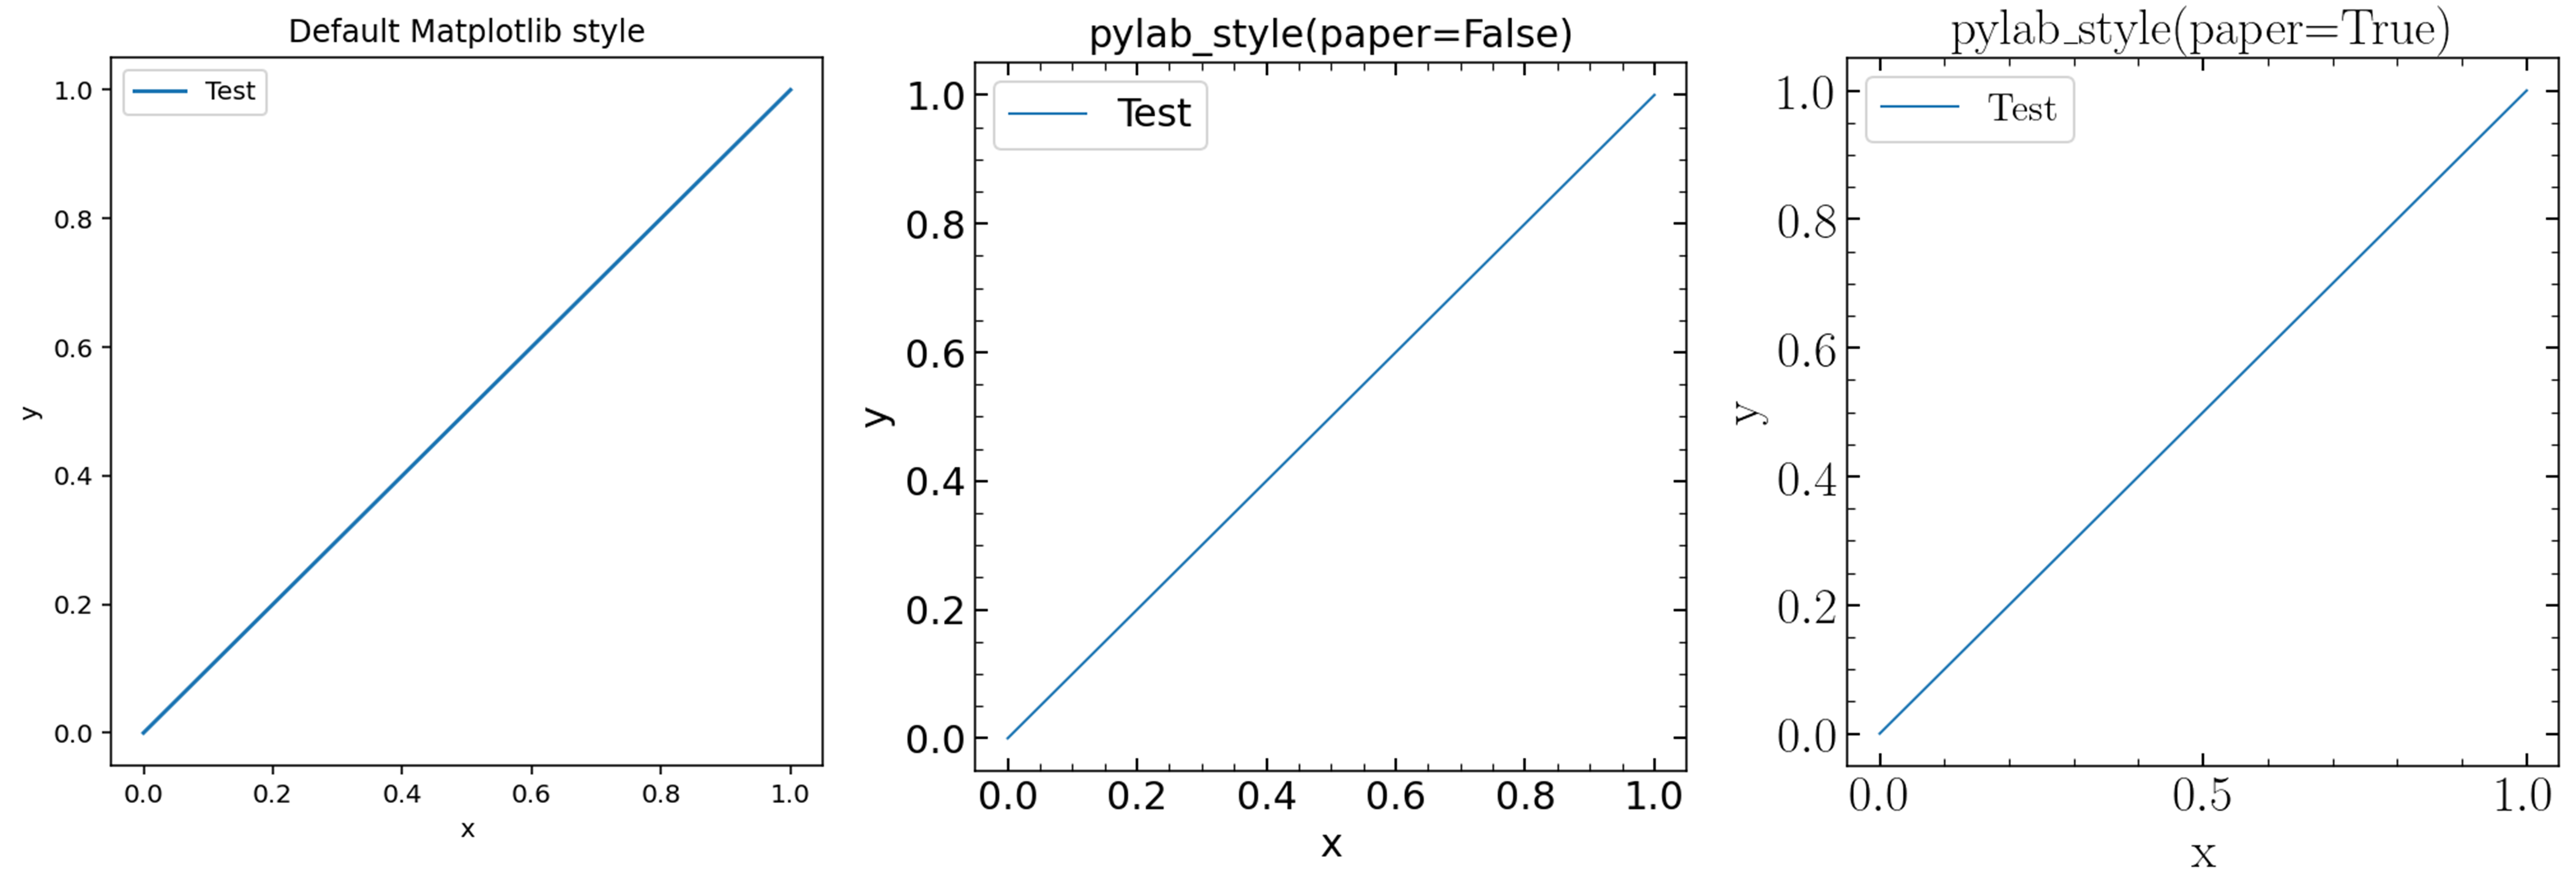
Here are a figure that compare different styles using the following matplotlib code
1plt.figure(figsize=(5, 5))
2plt.plot([0, 1], [0, 1], label="Test")
3plt.xlabel("x")
4plt.ylabel("y")
5plt.legend()